About
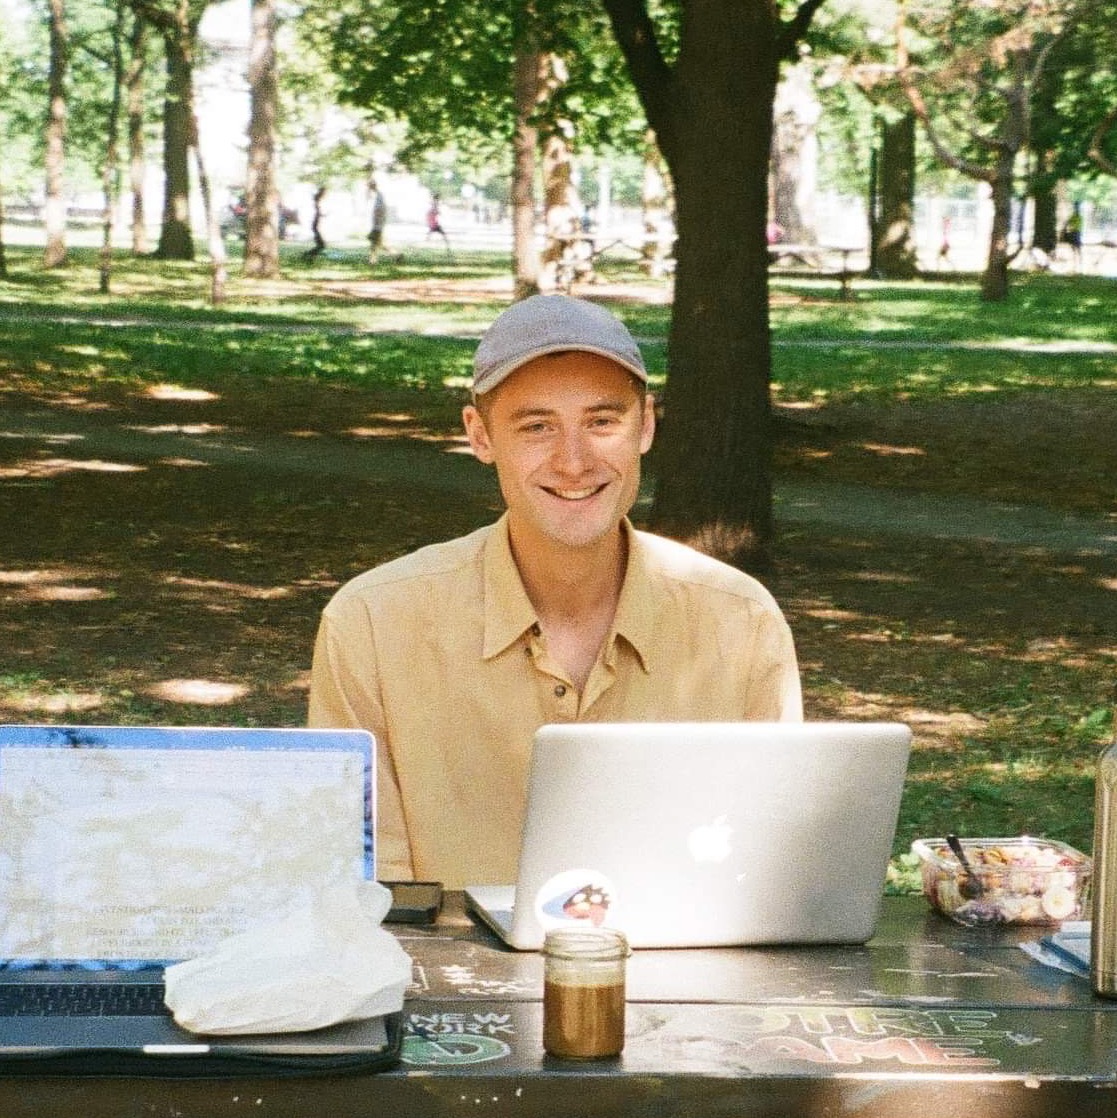
Hello! I'm Sam—a recently graduated Master's student living in Montreal. I have a background in spatial analysis, web tech and digital communication.
I currently work in the Data Exploration and Integration Lab at Statistics Canada. Before that, I was the a reseracher with AI for the Rest of Us, project manager for a research grant with Environment Canada and a digital journalist at Geothink.
I’m self-taught in web development and design. My most recent project is a web app for transcribing audio called Scription.
News
| Mar 2021 | Co-authored a paper on supervised classification and unsupervised topic modelling |
| Mar 2021 | Co-ran a workshop on civic AI at FAccT ML 2021 conference |
| Jan 2021 | Started as a research assistant for AI for the Rest of Us |
| Dec 2020 | Handed in thesis on interactive data visualization 📜 |
| Sep 2020 | Co-authored a paper on natural language processing to label Tweets |
| Mar 2020 | Developed a web app for transcribing audio |
| Oct 2019 | Became the Project Manager for a research grant with Environment Canada | Apr 2019 | Designed and taught a git workshop |
| Apr 2019 | Runner-up for best paper at SKI Canada, Banff ⛷ |
Projects
Scription
In early 2020, I needed to transcribe 20 interviews I’d conducted for my Master's research. I built a user interface on top of automated speech-to-text APIs to sync text to audio playback, making it easier to edit and annotate transcripts.
The Urban Sprawl Map
A web app visualizing the “connectedness” of the global road network. I designed/implemented the user interface using Bulma, managed development environments using npm scripts, and integrated D3 and Mapbox for the visualizations.
NetCDF climate data visualizer
Starting as a project in a geospatial web class, I made a application to visualise netCDF climate data on a web map. It uses a python script to generate json data files which are visualised in a Leaflet web map.
Website CodeBen Lumley Architect
My first website commission. Cheers Dad!
Speaking
FAccT workshop
I facilitated a workshop on civic empowerment in the development and deployment of AI Systems during the Fairness, Accountability and Transparency (FAccT) conference.
Student speaker series
I set up and ran a speaker series in the Geography department at McGill and secured funding for two years.
SKI paper presentation
I presented a paper that asked how map projections affect data interpretation at the Spatial Knowledge Information (SKI) Canada conference in Banff, Alberta.
Slides PaperGit workshops
I gave several workshops on how to use git in web development for the McGill GIC. I had participants use the command line and create/host a website using GitHub Pages.
